Big banks and other financial institutions often use analytics to build portfolios, as it can provide a number of benefits over traditional stock selection methods.
It’s easy to fall into the trap of using suboptimal techniques for stock selection and portfolio building. We may rely on gut feelings or traditional analysis methods that may not always lead to the best results. Alternatively, we may become too focused on a particular stock or sector and overlook other opportunities that may be more promising.
One simple yet often overlooked analysis technique is tracking stocks that are rising in recent times. While past performance is not always indicative of future results, stocks that have been performing well in the short-term may be more likely to continue their upward trend. By keeping an eye on these stocks, you may be able to identify potential investment opportunities that you may have otherwise missed.
Another simple yet effective technique is to diversify your portfolio. By including a range of stocks from different sectors and industries, you can mitigate the risk of concentrating your investments in a particular area. This can help to stabilize your portfolio and improve your chances of generating consistent returns over the long-term.
It’s important to keep an open mind and consider a range of analysis techniques when it comes to stock selection and portfolio building. Simple techniques such as tracking rising stocks and diversifying your portfolio can often be overlooked, but they can be powerful tools for improving your investment results.
Key advantage of using analytics for portfolio building is that it allows for more accurate and informed decision-making and tracking trends that might not be immediately apparent to the human eye. This can help to identify undervalued stocks or identify sectors that are likely to outperform in the future.
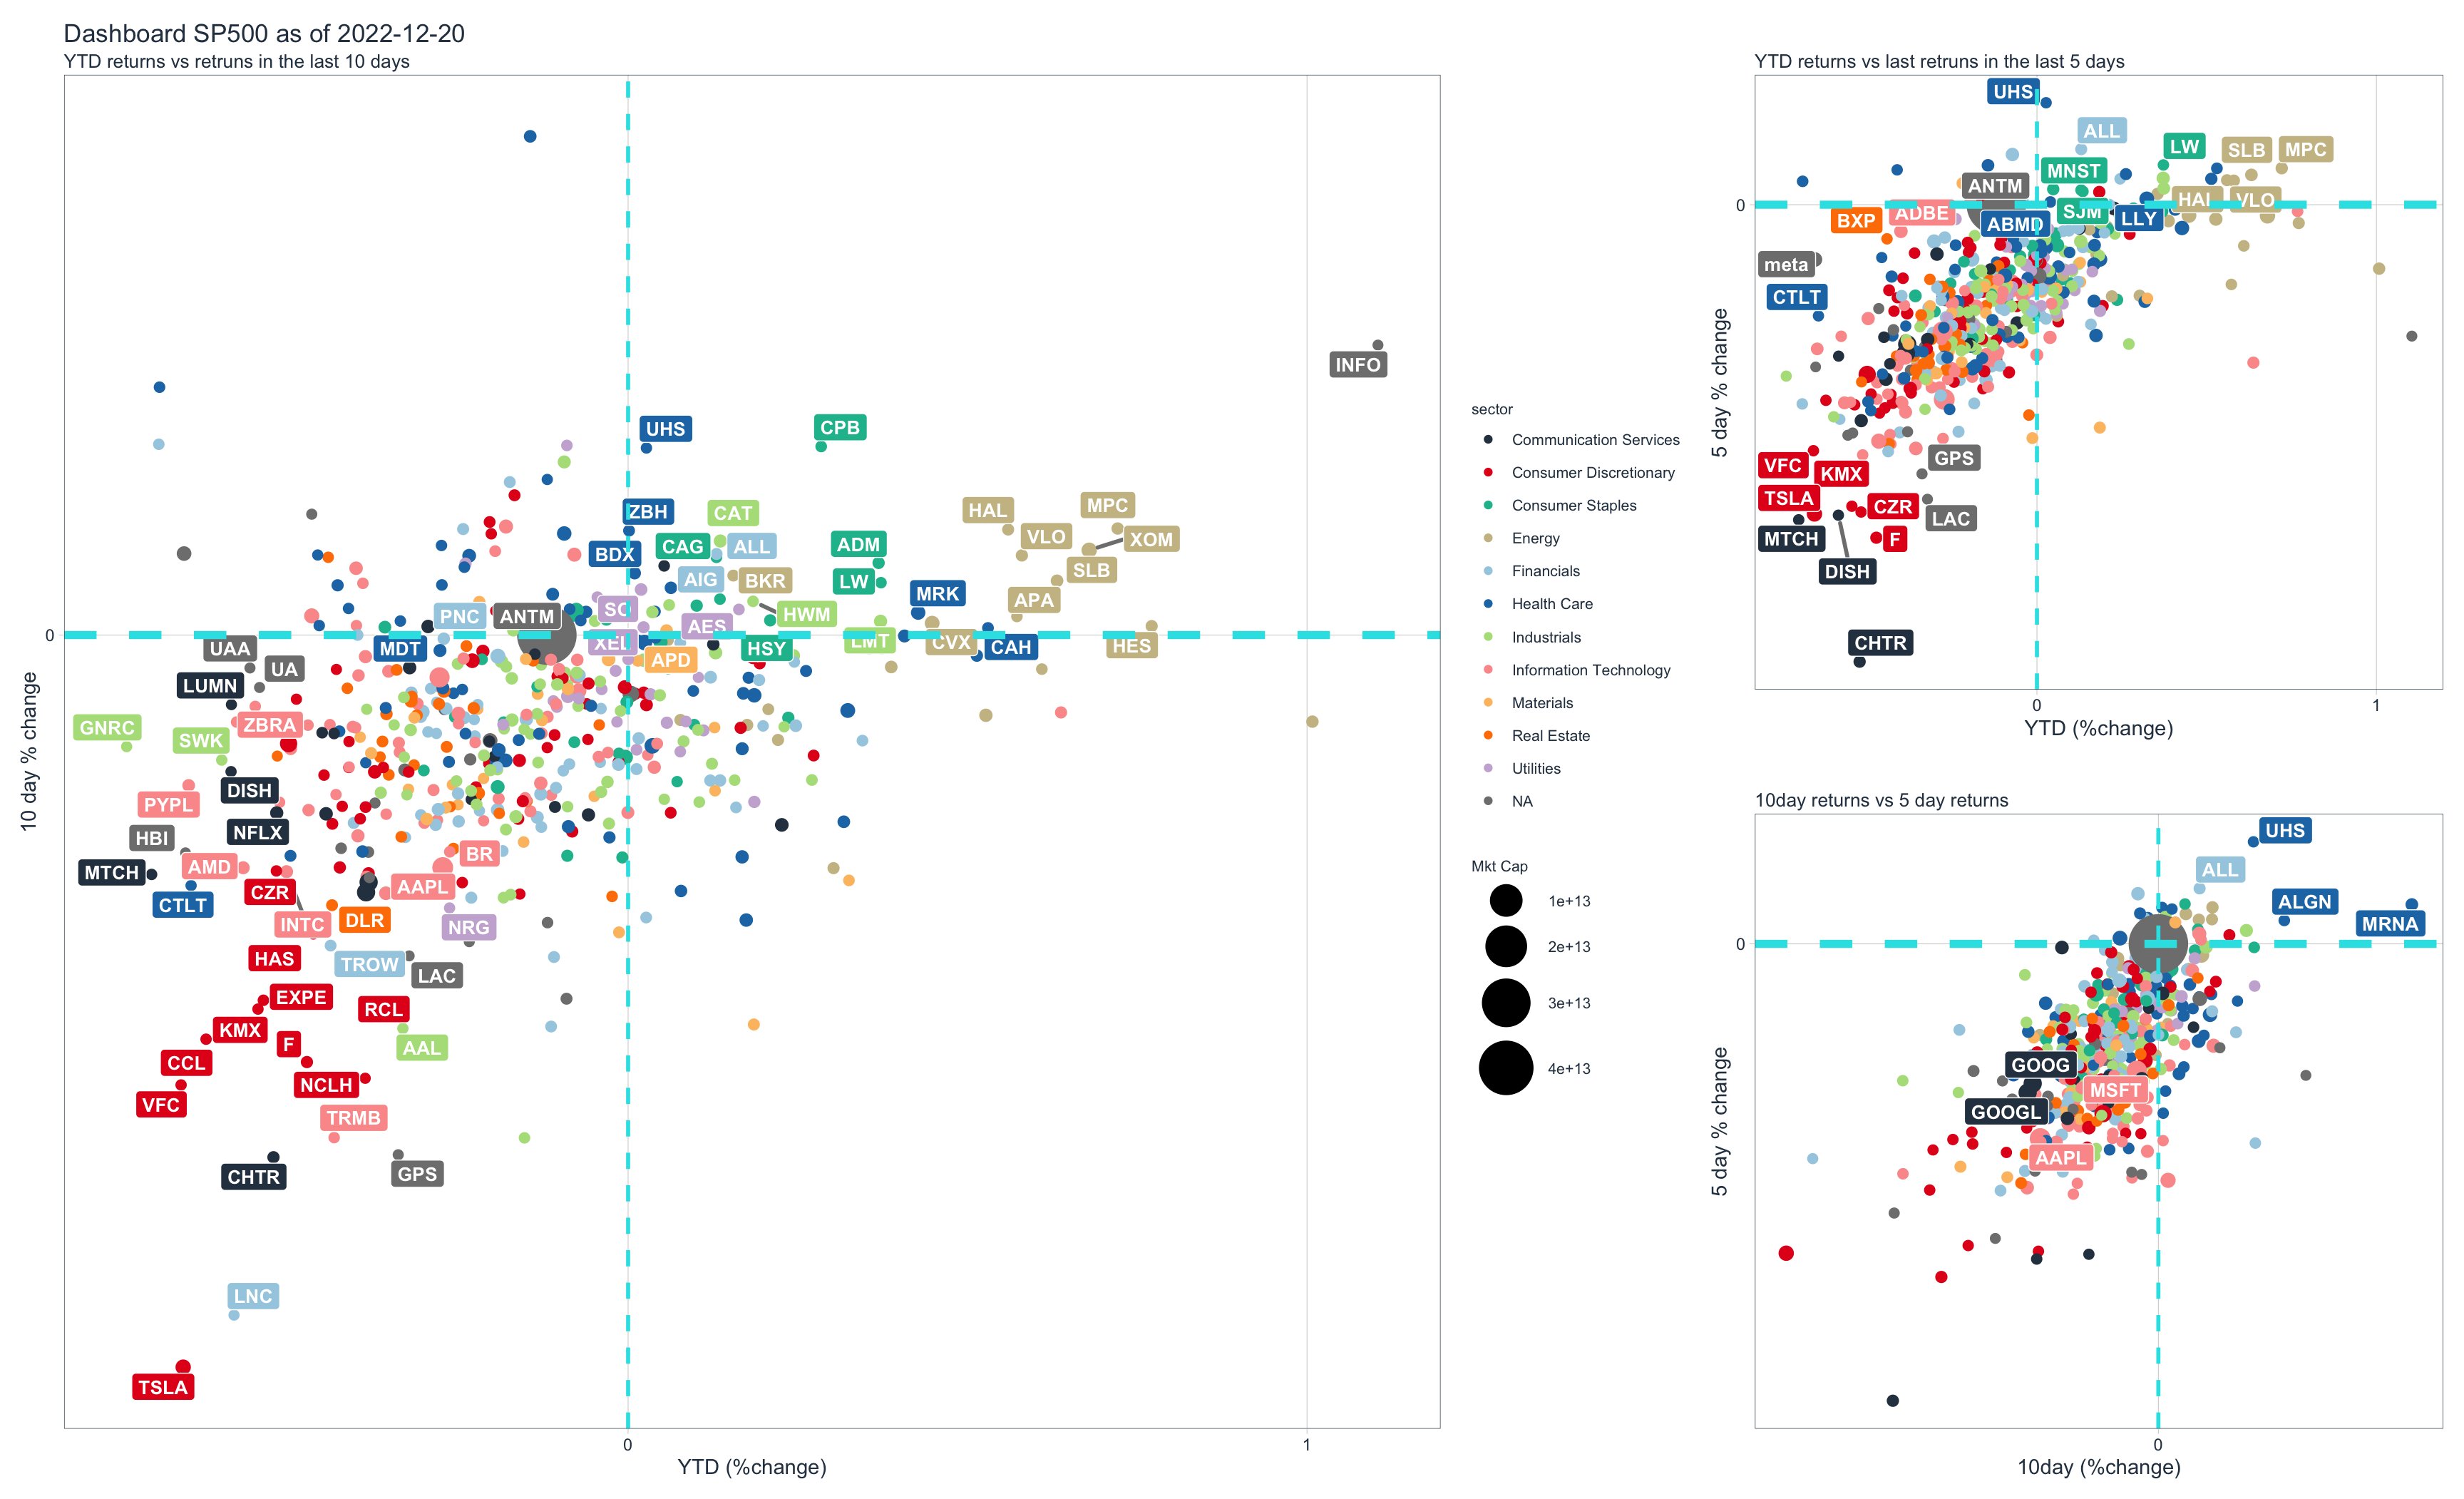
One tool that can be particularly useful for conducting analysis and building portfolios using analytics is the tidyquant package in R. This package combines the power of the tidyverse and quantmod packages, providing a wide range of tools for analyzing and visualizing financial data.
Integration of tidyquant with the ggplot2 package, which is a popular tool for creating visually appealing and informative plots in R makes it easier to view the analysis to better understand your financial data and make informed investment decisions.